
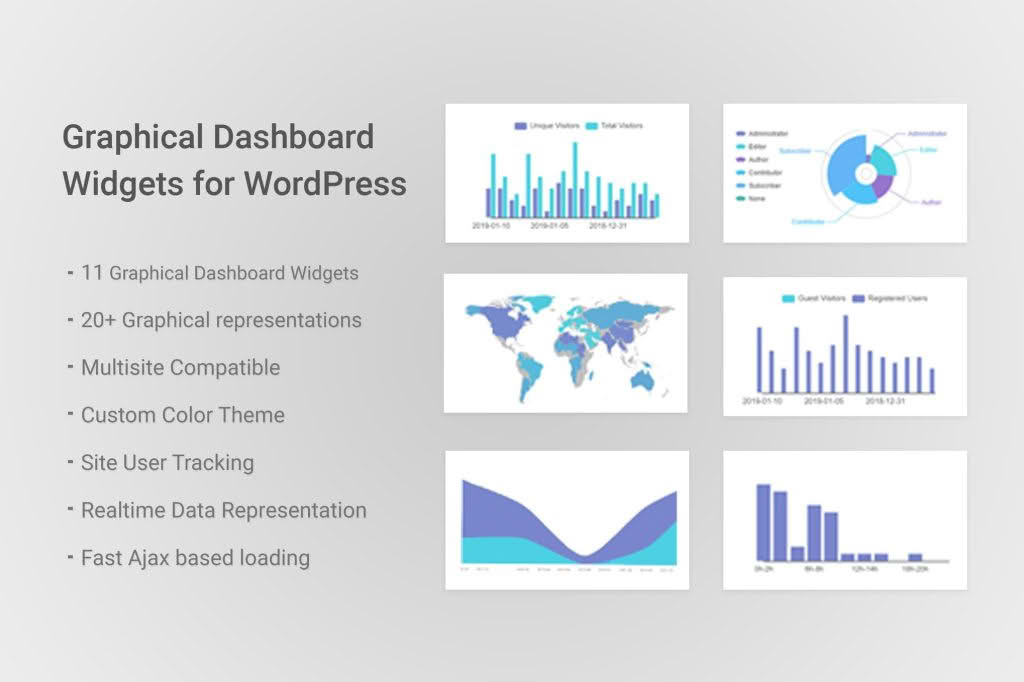
Transform your WordPress dashboard from a cluttered, text-heavy interface into a powerful, data-driven command center. Graphical Dashboard Widgets for WordPress empowers site owners, administrators, and developers to visualize critical site statistics, performance metrics, and user activity through intuitive, high-impact charts and graphs directly on the WordPress admin dashboard. Stop digging through sub-menus to find the data that matters most; bring your key performance indicators to the forefront so you can make informed decisions at a glance.
Key Features
- Visual Data Representation: Convert complex raw data into easy-to-read line charts, bar graphs, pie charts, and gauges.
- Customizable Dashboard Layouts: Drag and drop widgets to arrange your dashboard exactly how you want it, ensuring your most important metrics are always visible.
- Real-Time Analytics Integration: Seamlessly pull data from core WordPress functions or integrated analytics services to provide live updates on site traffic, user registrations, and content performance.
- Flexible Date Ranges: Filter your graphical reports by day, week, month, or custom date ranges to track trends over time effortlessly.
- Role-Based Access Control: Ensure sensitive data is only seen by the right people by restricting specific dashboard widgets to administrators, editors, or other custom user roles.
- Lightweight Performance: Engineered to provide deep insights without compromising your WordPress site’s loading speed or administrative performance.
Use Cases and Who It’s For
This plugin is designed for anyone who needs to monitor the health and growth of their WordPress installation without the hassle of navigating complex external reporting tools. Store owners using WooCommerce will find it indispensable for monitoring daily sales, top-selling products, and order trends without leaving their dashboard.
Content-heavy sites and publishers can utilize these widgets to track post performance, author productivity, and comment activity, allowing them to adjust their content strategy based on real-time engagement data. For WordPress developers and agencies, this tool is a game-changer when managing client sites. You can configure a standardized, professional dashboard for your clients, highlighting uptime, security status, and core updates, providing them with immediate peace of mind and demonstrating the value of your maintenance services.
Setup and How It Works
Getting started with Graphical Dashboard Widgets is designed to be straightforward, ensuring you spend less time configuring and more time analyzing your data.
- Install and Activate: Upload the plugin to your WordPress site and activate it through the Plugins menu.
- Configure Data Sources: Navigate to the plugin settings page to select which data points you wish to visualize. The intuitive interface allows you to toggle specific metrics on or off.
- Select Visualization Types: Choose the best chart format for each metric—for example, use a line chart for traffic trends and a pie chart for user role distribution.
- Manage Dashboard Widgets: Visit your main WordPress Dashboard. You will see the new widgets available in the Screen Options tab. Simply drag and drop them into your preferred layout.
- Refine and Monitor: Use the settings icon on each individual widget to adjust filters, date ranges, or refresh intervals to keep your data current.
Similar Plugins
If you are exploring your options for dashboard customization and data visualization, you may also encounter plugins such as WP Dashboard Notes for organizational tasks, or more specialized reporting solutions like Advanced Database Cleaner or various WooCommerce-specific reporting plugins that offer deep-dive analytics for e-commerce stores. While these plugins offer specific functionality, Graphical Dashboard Widgets stands out by focusing on the visual aggregation of diverse site metrics in a unified, user-friendly interface.