
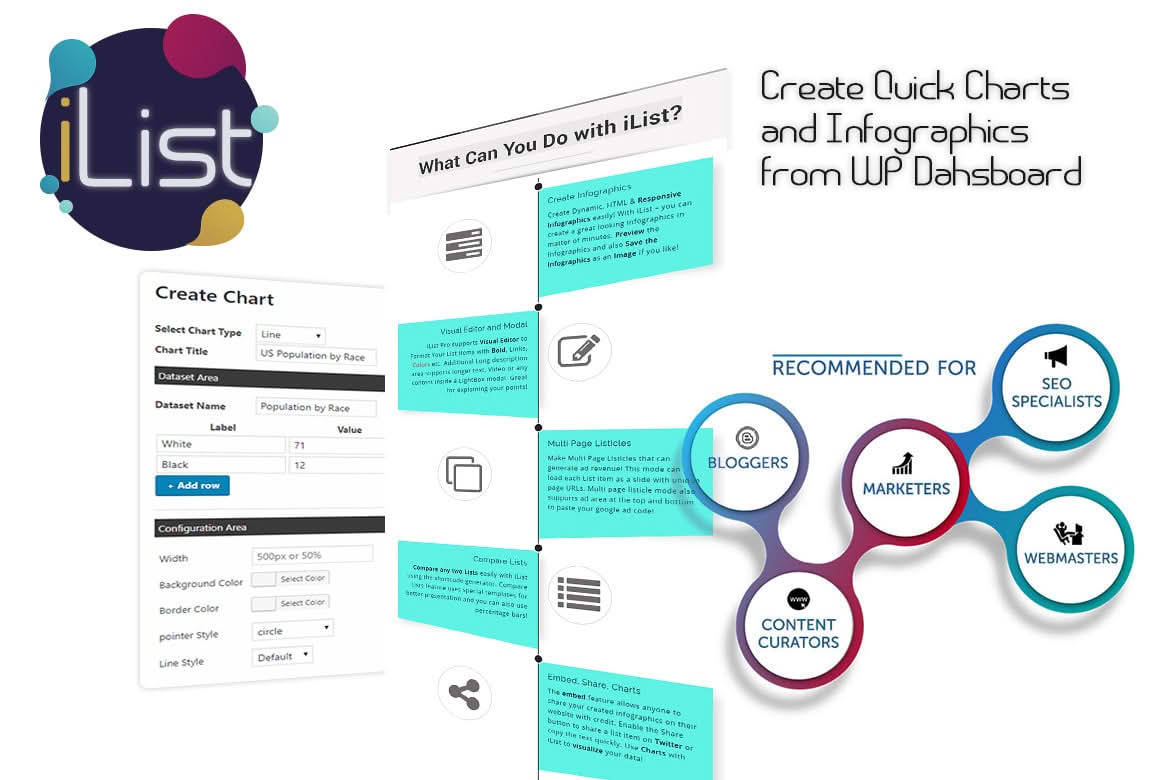
Transform dry data and complex information into visually compelling, easy-to-digest content directly within your WordPress dashboard. Infographic Maker – iList with Quick Charts is designed for content creators, marketers, and bloggers who need to boost reader engagement without hiring a graphic designer. By turning static lists and numbers into interactive, professional-looking infographics and charts, you can significantly increase time-on-page, improve information retention, and make your website content stand out in a crowded digital landscape.
Key Features
- Intuitive Drag-and-Drop Interface: Build complex layouts without touching a single line of code, ensuring a smooth workflow for users of all technical skill levels.
- Versatile Chart Types: Choose from a variety of chart styles, including bar, line, and pie charts, to best represent your specific data sets and metrics.
- Ready-to-Use Templates: Jumpstart your design process with a library of professionally crafted templates that can be customized to match your brand identity.
- Responsive Design: Ensure your infographics look perfect on every device, from desktop monitors to mobile phones, automatically adjusting for optimal readability.
- Interactive Elements: Enhance user experience with hover effects and clickable data points that encourage visitors to engage deeper with your content.
- Seamless WordPress Integration: Create and manage your infographics directly within the WordPress editor, allowing you to insert them into posts and pages with ease.
- Customizable Styling: Tailor fonts, colors, and spacing to ensure your infographics align perfectly with your website’s existing theme and design language.
Use Cases / Who It’s For
This plugin is an essential tool for anyone tasked with communicating information clearly and effectively. Bloggers and content marketers use it to turn long-form articles into summarized infographics that are highly shareable on social media platforms. Educational websites leverage the tool to simplify complex concepts for students, making learning more visual and accessible.
Business owners and agencies find the plugin invaluable for creating professional reports, displaying service comparisons, or showcasing company milestones on their websites. Whether you are a non-profit organization visualizing impact statistics, a tech site comparing product specifications, or a lifestyle blogger listing top recommendations, this plugin removes the friction between having data and presenting it beautifully.
Setup / How It Works
- Install and Activate: Upload the plugin to your WordPress site and activate it through the plugins menu.
- Create a New Project: Navigate to the plugin dashboard to start a new infographic or chart project.
- Select a Template or Layout: Choose a pre-designed template that fits your needs, or start from a blank canvas to build a custom layout.
- Input Your Data: Use the user-friendly interface to add your text, images, and numerical data. The system automatically formats your input into the selected chart or list style.
- Customize and Style: Adjust colors, fonts, and layout settings to ensure the final result matches your brand guidelines.
- Publish: Once satisfied, use the provided shortcode or the dedicated block editor element to insert your infographic into any post or page on your site.
Similar Plugins
If you are exploring options for visual data representation in WordPress, you may also want to consider plugins such as Visualizer: Tables and Charts Manager for WordPress, or wpDataTables, which specialize in creating responsive charts and tables from various data sources.